Hourly matching without additionality has little to no impact on emissions reductions

This post explains one set of findings from a larger research paper.

The full overview and paper are here: Impact Accounting and Hourly Matching: A Review

Hourly matching only accelerates renewable energy progress if additionality is part of the standard

The current proposal for an hourly matching standard in the Greenhouse Gas Protocol Scope 2 reporting standard does not include requirements that matched energy be additional. This means that voluntary corporate clean energy buyers could claim energy attribute certificates (EACs such as RECs or GOs) from already-built clean generation resources towards reducing their carbon footprint. This will likely lead to lower amounts of clean energy on the grid and higher emissions compared to a stricter standard.

Additionality is defined as an intervention that causes an action that would not have occurred otherwise. For example, a corporation signing a voluntary PPA for solar or wind energy (the intervention) provides the financial certainty for a new clean energy project to get financed, built, and interconnected to the power grid (the caused action). This has long been understood as a critical principle of clean energy procurement necessary to cause the desired reduction in carbon emissions (Bjørn et al. 2025).

Previous studies have reported that hourly matching can reduce emissions, but almost all of them assume at least some level of additionality for the procured renewable resources. Only one work (Ricks et al. 2023) considered hourly matching without an additionality requirement, in the context of US hydrogen production, and found that without additionality “a 100% hourly matching requirement loses all of its consequential impact." 

In order to understand the impacts of an hourly matching standard as it is currently proposed, we used the PyPSA-Eur capacity expansion and dispatch model to analyze the impacts of an hourly matching standard with and without additionality requirements in the European grid in 2030. We find that a non-additional hourly matching standard has little to no impact on total system emissions.

How our analysis modeled additionality and hourly matching

Because true additionality depends on a counterfactual, it can be difficult to determine outside of models. Instead, a “new build” requirement is often used as a benchmark for additionality in renewable energy. Many groups have also proposed that for a project to be additional, there needs to be a long-term contract, which has been shown to significantly reduce risk for renewable project financing.

Meanwhile, purchasing energy from an existing project that has already been built and is already in operation is — by definition — not additional, since the action (building the generation resource) happened before the intervention (purchasing the RECs).

We modeled additionality using scenarios where only new build resources are allowed to count towards the hourly matching goals, and modeled non-additionality using scenarios where clean generation of any age can count towards the hourly matching goals (consistent with current GHGP Scope 2 proposals).

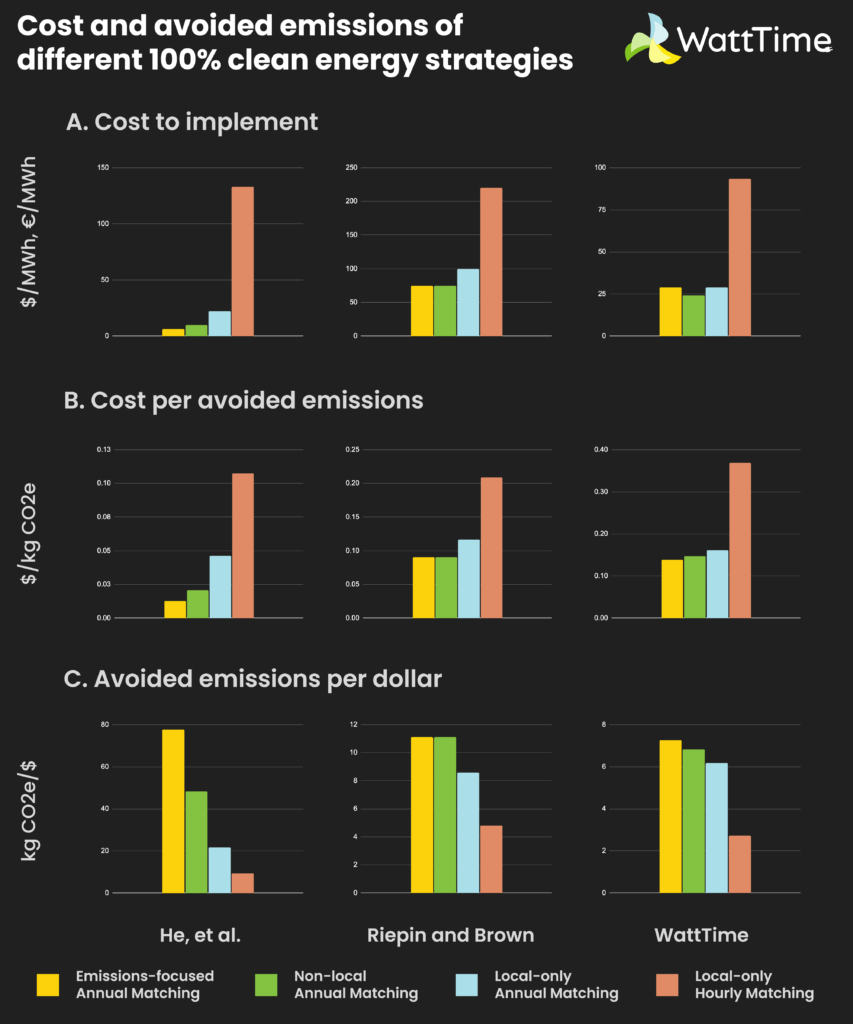
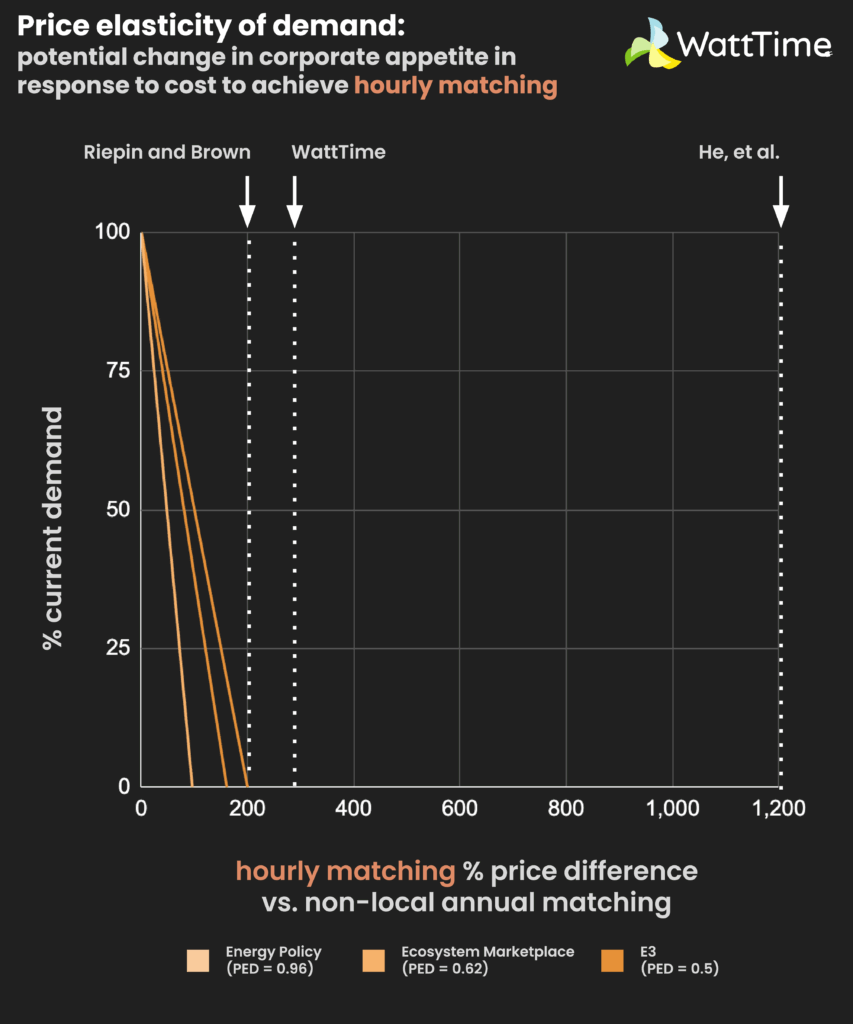
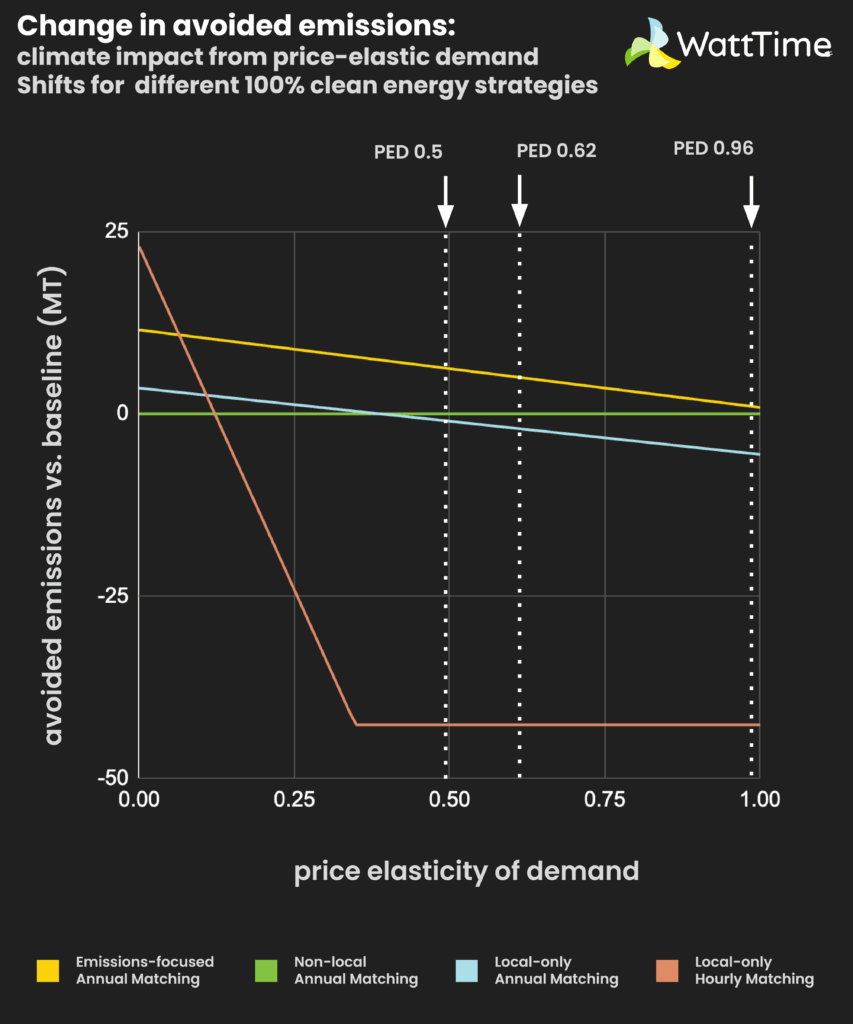
From an economic perspective, consumer demand for hourly matched RECs could increase the supply of clean energy, if the demand is high enough. In practice, we see that supply of unbundled RECs often surpasses demand, leading to low REC prices that have little impact on causing additional new renewable resources to be built.

Hourly matching proponents argue that its time-matching requirement will make REC supply scarce during certain hours, driving up the cost of RECs in those hours and leading to more investment in clean resources that generate during those times. However, this effect only occurs if the demand for RECs in those hours substantially exceeds the supply.

If unbundled RECs from existing generators are allowed (as in the current Scope 2 proposal), our modeling indicated that in the case of the European grid in 2030, a demand for clean energy attributes from 25% of all commercial and industrial (C&I) load is insufficient to cause investments that lead to significant emissions reductions.

Modeled scenarios

We also investigated the impacts of different methods of accounting for clean attributes of energy consumed from the grid.

For all three of these scenarios, we modeled a requirement that procured resources are all new build (additional). We then modeled the scenario (“No New Build Req”) where there is no new build requirement by allowing consumers to count any amount of clean energy credits up to the total amount available on the grid.

An illustration of different ways of counting grid CFE for an hour with the same amount of purchased CFE. Assuming an hour where 50% of generation on the grid is carbon free and participating consumers have 75% of their load matched by a carbon-free PPA resource. If Grid CFE is counted proportional to “imports”, the 50% of CFE on the grid is applied to the 25% of load that is not met by the purchased CFE, increasing the hourly matching score by 12.5% to a total of 87.5%. If Grid CFE is counted using the SSS, the 50% of CFE on the grid is applied to the entire load, increasing the hourly matching score from 75% to 125%. If there is no new build requirement, consumers could meet up to 100% of their matching requirement with clean energy credits from grid resources if their demand is less than the total amount of clean energy credits on the grid in that hour.

No additionality means no impact

Without a new build requirement, we find that hourly matching has no emissions benefit for matching levels up to 90%. Even at a 100% hourly match, it has only a small benefit (4 MT) compared to the emissions caused by the load (62 MT). This is likely because there is a large amount of carbon-free energy already on the grid in Europe in 2030 without the addition of corporate procurement. If the corporate procurement is not limited to new build, buyers can take credit for the many carbon-free generation sources that already exist on the grid, including wind, solar, nuclear, and hydro. These purchases are non-additional, so they do not lead to changes in total system emissions. To achieve 100% matching, some additional resources are required, but they amount to a comparatively small amount of wind and battery storage resources. The battery storage resources are mostly dispatched to charge during times when there is excess CFE credits available and discharge during hours when there are fewer.

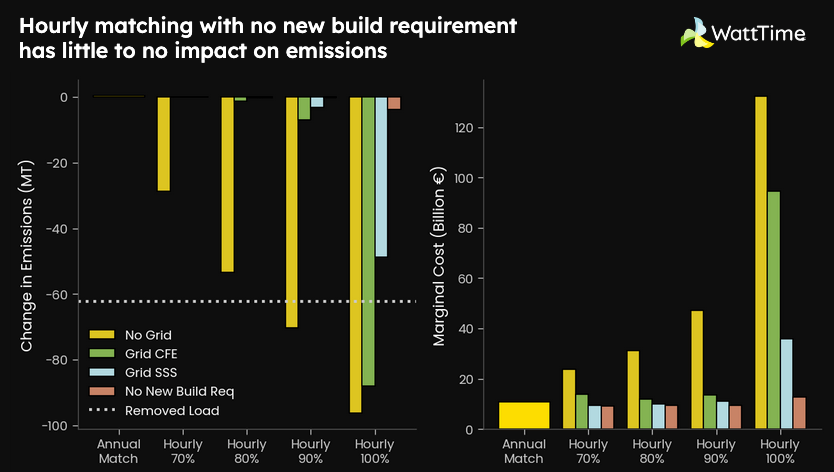
If a new build requirement was added, hourly matching is only impactful at high levels of hourly matching or if grid resources are not counted towards the hourly match. But these high-impact scenarios are also much higher in cost. Hourly matching that counts grid CFE either proportional to “imports” or SSS can have a significant impact on emissions if 100% hourly matching is achieved. However, below 100% matching, the emissions-reduction impact is small to non-existent. Again, this is likely caused by the high levels of CFE already on the European grid, which means corporate buyers can take credit for those existing resources and have a fairly high hourly matching score. The scenarios where no CFE from the grid is counted have a higher impact at all levels of matching, but also come at a much higher cost, exceeding €120 Billion in the 100% matching case. These high costs could be a deterrent, reducing the number of corporations willing to pursue voluntary renewable purchasing.

These results show that the specifics of how an hourly matching standard is written can lead to massive differences in reported emissions without any change in real-world grid decarbonization. The current proposed standard, which lacks a new build additionality requirement, will increase the difficulty of implementation by requiring more detailed accounting, but is likely to lead to little to no actual reduction in emissions. Adding a new build requirement to the standard could increase the impact, but it is highly dependent on how grid resources are counted towards the standard. The scenarios where impact is high come with a high cost however, which corporate buyers may not be willing to pay. This study also highlights the importance of considering all of the details when comparing a proposed standard to existing studies, as those studies may not apply to the proposed standard (as is the case here). This is the first time that hourly matching without a new build requirement (as proposed) has been studied, so previous research on hourly matching should not be used to project the impacts of the current proposed standard.

These results are part of a larger study we plan to release in the near future. If you are interested in learning more about it, or would like to access the code or data that was used to model these scenarios, please contact nat@watttime.org.

hero image: iStock / shaunl

Analysis: mandatory hourly matching’s high costs would likely kill so much clean energy procurement, it would increase total long-run emissions.

This post, a summary of this paper, explains one set of findings from another broader research paper.

The full overview and broader paper are here: Impact Accounting and Hourly Matching: A Review

As the GHGP undertakes revisions to its Scope 2 guidance to evolve beyond the current status quo of annual matching, hourly matching with tighter market boundaries (aka 24/7 CFE) is a prominent contender.

Studies suggest that if a company's hourly matching percentage is high enough and the clean energy is fully deliverable — both big assumptions — hourly matching could avoid more emissions than current annual matching. But... and it's a big but... hourly matching is SIGNIFICANTLY more expensive.

That added cost could have a large negative influence on the voluntary corporate clean energy procurement market. The core economic principle that underpins this concern is “demand elasticity”: that when something becomes more expensive, companies will do less of it. And in this case, the “it” is voluntary clean energy procurement.

If the GHGP mandates hourly matching, it might increase the beneficial impact of each company that continues to buy renewables following GHGP guidance, but it would also reduce the number of companies who do so. So, we investigated the net result of those two opposing forces. In this analysis, we take a closer look at the numbers, using both third-party, peer-reviewed studies (such as He, et al. and Riepin and Brown) and WattTime data.

Our analysis finds that, based on best available data, it is very likely that the GHGP mandating hourly matching would increase emissions compared to the status quo, not reduce them.

Modeling four procurement scenarios

To study this question, we developed a method of simulating procured renewable energy portfolios using cost [1,2] and load [3] assumptions provided by the National Renewable Energy Laboratory (NREL). The simulation solely considers costs of the total estimated levelized cost of energy and transmission for projects and does not include any revenue or costs from grid electricity markets. 

We simulate portfolios for each grid region in the US in the year of 2030, and then estimate the avoided emissions from each strategy using the Long Run Marginal Emissions Rate (LRMER) provided by Cambium. The strategies we considered fall into four categories:

Hourly matching is ~600% more expensive than the status quo

Compared to the current guideline of non-local annual matching, annual matching with a local procurement constraint was only ~60% more expensive on average (range: 20% to 120%). Emissions-focused annual matching was at cost parity with non-local annual matching (range: -40% to +20%). By sharp contrast, hourly matching was an average 600% more expensive (with a range of 200% to 1,200% across others’ studies and WattTime analysis).

Each of these studies — He, et al., Riepin and Brown, and WattTime — looked at a different set of locations and times, so cost variations are expected. However, each of these studies found a very significant cost premium for achieving 100% hourly matching, as well as large differences in the cost to achieve each kg of avoided carbon emissions. Below we show our estimates alongside others in the literature.

Understanding how cost might affect participation 

But how might these higher costs for hourly matching affect corporate participation and total emissions impact?

To answer that question, we need three things. 

First, we need to know the level of demand at the current status quo cost. How many companies currently have net-zero emissions targets under current Scope 2 rules? How much C&I electricity load do they represent? How much clean energy does that imply? 

Many studies include a scenario in which 10% of commercial and industrial load participates in net-zero claims. Our best estimate is that this is reasonably close to the actual status quo in real life (under the current system of non-local annual matching) because in 2024, total contracted energy in the US by corporations was 74.6 GW [4], which most closely matches the size of the non-local annual portfolio.

But how would companies respond to a change in cost for implementing their net-zero emissions and/or 100% clean energy strategy? This relationship between participation and price can be estimated the same way models estimate how much renewable energy grid will build: using supply and demand curves. 

So second, we need a supply curve. This curve represents how much it would cost for any given amount of companies (measured in their associated megawatts) to achieve net zero under the GHGP depending on what the rules are. We can calculate that based on the existing literature and the cost simulations above.

Lastly, we need a demand curve: a way to estimate what levels of participation to expect at different levels of cost. The shape of a demand curve is usually measured by its price elasticity of demand. And the price elasticity for corporate net-zero claims is not known. But, it can be instructive to ask what would happen if it is anywhere close to typical values that have been measured in similar markets, to get a sense of the scale. We found several examples in the literature: 

So while the actual price elasticity of demand for net zero claims under the GHGP is not known, the best estimates we have show a range including 0.96, 0.62, and 0.5.

Hourly matching’s high cost would push some corporates out of the voluntary clean energy procurement market, increasing emissions by an estimated 42.6 million tonnes annually

The big-picture takeaway is alarmingly clear. At a range of potential cost premiums to achieve hourly matching and across a range of demand elasticities, GHGP mandating hourly matching would effectively kill voluntary corporate clean energy procurement. The median estimate is that it would increase grid emissions by 42.6 MT CO2e per year, compared to existing GHGP standards of non-local annual matching.

By contrast, emissions-focused annual matching avoids more emissions than non-local annual matching at all values of demand elasticity, because while it has a slightly higher price than non-local annual matching, it also has a higher avoided emissions rate that compensates for the potential decrease in participation. 

Weighing the risk: could high costs undermine net-zero progress?

Of course, we can’t predict exactly what would happen if costs skyrocket. Supply and demand curves represent an idealized version of economics with many simplifying assumptions. Perhaps the demand elasticity of companies to make net zero claims under the GHGP is far lower than clues from previous studies suggest. Or perhaps companies might abandon their net zero claims, but still try to achieve fairly low emissions. Maybe.

But this is a big risk to take. Across several studies, the price premium for achieving 100% hourly matching has been shown to be at least 200% higher than the current standards. For that to fail to significantly reduce participation would require a massive, almost-unheard-of decrease in price elasticity. 

Further, this risk is not hypothetical. Like our analysis, E3’s 2024 study cautioned that “increases in [energy attribute certificate] EAC prices may reduce the voluntary demand for clean energy generation.” Their analysis estimated that a 4x increase in EAC prices could lead to an increase as much as 102 million tonnes per year. More recently, a survey of clean energy buyers by Green Strategies has found that “nearly 80% of respondents lack confidence that they would be able to procure time-matched clean electricity within smaller market boundaries. Respondent insights indicated concern over higher costs and whether suppliers will be able to provide resources that meet time and location criteria.”

And last week, another survey by the Clean Energy Buyers Associate found that 75% of their members are opposed to mandatory hourly matching, stating that it is “very difficult to implement”.

The rising costs of renewable energy and the changing political climate have created an environment where keeping net-zero commitments is a much more challenging goal to justify than it used to be. Raising the costs still further could make it very challenging to justify continuation of this goal to executives outside the sustainability team.

Again, this study is not conclusive. But the preponderance of evidence suggests that the massive price disparity between 100% hourly matching raises a very strong risk that the GHGP mandating hourly matching would on net cause enough price-sensitive companies to cease participating than it would on net increase emissions, not decrease them. Meanwhile, emissions-focused procurement and other carbon matching strategies would not increase costs while reducing emissions.

Future research into the effects of mandatory requirements of voluntary programs should consider effects on voluntary program participation and how that impacts total emissions. But in the meantime, the GHGP should strongly consider that what evidence does exist suggests they are currently trending toward a policy change that will increase emissions, not decrease them. 

image source: Pexels | Tom Fisk

UNFCCC marginal emissions data show that building renewables in the Global South has greatest benefit

This post explains one set of findings from a larger research paper.

The full overview and paper are here: Impact Accounting and Hourly Matching: A Review

For companies and other organizations investing in new renewable energy projects, two main strategies guide their procurement:

  1. 24/7 Carbon-Free Energy (24/7 CFE): focuses on hour-by-hour megawatt-hour (MWh) matching of renewable generation’s timing and a corporation’s electricity demand load profile, with the clean energy procured from the same grid region where the electricity load is located
  2. Emissionality: an emissions-first approach that targets the dirtiest grids globally, procuring clean energy from wherever the new renewable capacity will have the greatest avoided emissions benefit by displacing generation from the most-polluting fossil-fueled power plants

These two strategies have important implications for where clean energy investment will flow and where new renewable capacity will get built, and consequently, on how much (or how little) climate benefit those projects will ultimately have.

In this analysis, we use marginal emissions data from the United Nations Framework Convention on Climate Change (UNFCCC) to gain insights into these questions, especially: Does location matter for the avoided emissions benefit of a new renewable energy project? And if so, where should new renewable energy projects get built to have the greatest overall climate benefit?

Tapping the UNFCCC’s marginal emissions data

To better understand the beneficial impact of new renewable projects across the globe, the UNFCCC — the UN body that oversees the Paris Agreement — developed a methodology for estimating the long-term impact on grid emissions in each country around the world. UNFCCC’s combined margin emissions factors take into account both operating margin and build margin, giving a sense for renewable energy’s climate benefit in the nearer and longer terms.

Using data from the IEA’s Global Energy and Climate Model (previously known as the World Energy Model) — which underpins IEA’s annual World Energy Outlook — UNFCCC experts calculated the marginal emissions rates resulting from predicted new generation across both traditional firm energy sources (e.g., fossil fuels, nuclear, geothermal) as well as clean energy technologies (e.g., solar PV, wind, tidal). The IEA model incorporates information on existing energy sources, economics, and policies in 26 large countries and regions, with additional regression modeling for other countries, making it comprehensive in breadth and scale.

Mapping renewable energy’s avoided emissions potential

Looking at a global heat map of marginal emissions rates for new renewable energy sources, the greatest avoided emissions potential based on UNFCCC data is primarily located in the Global South, in countries spanning Asia, Africa, and Eastern Europe (red shades on the map). These countries’ grids tend to rely on heavier-polluting sources of generation, such as coal-fired power plants.

Conversely, the lowest avoided emissions potential is primarily in the Global North, in countries spanning the EU and North America, as well as select countries elsewhere around the world where hydropower (and sometimes, nuclear) provides a dominant share of electricity generation (blue shades on the map).

Power grid combined marginal emissions factor by country map of the world

Multiplying the avoided emissions benefit of renewable energy investment

For any organization deciding where to invest in new renewable capacity, using marginal emissions estimates like these from UNFCCC can lead to much larger reductions in overall global emissions.

In Annex I countries (which largely overlaps with the Global North), the average avoided emissions rate (weighted by total electricity generation) is 345 g CO2/kWh. Meanwhile, countries in the top 50% of most-polluting power grids have an avoided emissions potential of 702 g CO2/kWh, and countries among the top 10% of most-polluting electricity generation have an avoided emissions rate of 979 g CO2/kWh. These heavier-polluting power grids are predominantly throughout the Global South.

In other words, investing in renewable energy projects across the Global South can yield 2x to nearly 3x greater climate benefit vs. renewables projects in the Annex I countries of the Global North. Organizations considering siting renewable energy — whether bilateral national agreements now being drafted under the revised Article 6 framework of the Paris Agreement, or voluntary corporate actors using the GHG Protocol — may want to consider UNFCCC’s data when deciding where to invest in renewable energy projects.

Avoided emissions rate of renewable energy projects by global countries category column chart

How procurement approach influences renewable energy’s potential

24/7 CFE proponents argue that it encourages the buildout of renewables that would generate during “off” hours, helping power grids move closer to 100% clean energy around the clock. This may be partly true. But it also amounts to massive investment aimed at “squeezing the last drop” of emissions from grids that have already significantly decarbonized. This misses opportunities for major larger global decarbonization by building renewables in other places where they’d have greater avoided emissions benefits and where coal-fired generation still dominates the grid mix.

Moreover, some of 24/7 CFE’s biggest proponents are major tech companies whose operations and data centers are overwhelmingly located in the EU, US, and other Global North locations. These are regions that have already seen large investment in new wind and solar capacity, especially. Meanwhile, Global South locations — the same places where UNFCCC marginal emissions data show there are the greatest avoided emissions opportunities — have seen chronic underinvestment in clean energy technologies, according to IEA data.

From a global climate action perspective, it’s far less impactful to inch California or Texas (where wind and solar have already made huge gains) closer to 100% carbon-free energy than it is to invest in new renewables in a place such as India, where coal still contributes more than 70% of the nation’s electricity generation and clean energy investment in 2024 was just one-fifth of what it was in the US.

On top of this compelling climate argument, there’s also the crucially important humanitarian component, too. Investing in renewable energy in Global South countries will also bring economic and health benefits by expanding energy access and reducing air pollution in the places that also have the worst air quality. Globally, 1 in 8 deaths are now attributed to air pollution, predominantly in countries with the most-polluting electric generation, since the same power plants spew both carbon dioxide and PM2.5.

Conclusion

The UNFCCC model is not the only model for estimating marginal emissions rates. One key difference from WattTime’s MOER model is that the UNFCCC model does not account for imports. This can significantly affect rates when low-emission countries border high-emission ones, as is the case with Sweden and Finland. In terms of long-run build margin, the UNFCCC also lacks many of the more-detailed features of other models such as Cambium, GenX, and PyPSA. In particular, it does not consider variance in emissions rates within a country, which can be great in large countries such as the US or China. But it is one of the only existing models that covers the entire globe, which is a critical consideration when evaluating emissions reductions. 

More research is needed to evaluate these different modeling approaches and to develop more detailed models across the globe, so that renewable energy investments can be targeted at the location where they have the most impact. For now, one thing is clear: data is increasingly pointing to the Global South as a critical focus for the world’s future renewable investment.

image source: iStock | rvimages