Why hydro-dominated grids can have surprisingly high marginal emissions rates
What do Norway, Sweden, Quebec, and the US Pacific Northwest all have in common? They have grids with significant hydro capacity. In fact, over 90% of Quebec’s electricity generation comes from hydro.
Hydro is commonly considered one of the cleanest sources of electricity — it emits no CO2 during generation1 — so it may be tempting to assume that grids dominated by hydro generation would have a relatively low marginal emissions rate.2 And yet, we find that in these predominantly hydro-powered regions, the marginal emissions rates are high, sometimes even as high as those of their fossil-fuel-dominated neighbors.
Why? It all boils down to whether consuming more electricity causes hydro to produce more electricity — and this usually isn’t the case.
In this article, we’ll explain the mechanics of how hydro-dominated grids respond to changes in demand, what that means for CO2 impact, and why this can lead to higher-than-expected marginal emissions rates in otherwise clean grid regions.
Types of hydro power
Hydropower plants differ by how they manage their water flow and storage, and they largely fall into these four categories:
- Reservoir hydro: These facilities use a dam to store large volumes of water in a reservoir, with controlled release through turbines, allowing generation to be precisely dispatched regardless of immediate river flow. (Typical plant size: 100 MW to 2+ GW) Example: Hoover Dam.
- Run-of-river hydro: These plants generate electricity using the natural flow of a river, often diverting to a pathway with turbines. With little to no ability to store water for later use (unless downstream of another hydro dam), these are a variable electricity source, dependent on fluctuating river flow. (Typical plant size: less than 1 MW to 100+ MW) Example: Chief Joseph Dam.
- Pondage hydro: A run-of-river approach that uses a smaller reservoir (a "pond") to provide enough flexibility to meet daily or hourly fluctuations in electricity demand. (Typical plant size less than 1 MW to 100+ MW) Example: Ghazi-Barotha Hydro.
- Pumped storage hydro: This system acts as a giant water battery, pumping water to a higher elevation when demand is low and releasing it through turbines to generate power when demand is high. (Typical plant size: 300 MW to 1+ GW) Example: Cortes-La Muela.
Of these types, reservoir hydro provides the most energy generation capacity worldwide, so when we generalize using the term "hydro," we are referring to reservoir hydro. And when we cite aggregated hydro generation in a region, it is also typically dominated by reservoir hydro.
Hydro is a finite resource
There is a fixed amount of electricity (MWh) that any type of hydro generation plant can produce in a given year based on the amount of rainfall, snowmelt, and other water flowing into the dam. If electricity demand increases above what can be provided by the hydro resource, then the additional power will have to come from other resources, typically fossil generation, since they can simply purchase more fuel.
For example, here is a simplified annual case: Let’s say there is a region similar to Washington State that has 100 TWh of annual electricity demand. Of this, about 60 TWh comes from reservoir hydropower, and the remaining 40 TWh comes from fossil fuels and other sources. Because hydropower depends on water availability, if annual demand grows by an extra 5 TWh beyond this total, that new demand would have to be met by fossil fuels or other dispatchable sources (40 -> 45 TWh), since the annual hydro output is dependent on rainfall, not the operator’s decisions (fixed at 60 TWh).
This concept is observed in the real world during drought years, when total hydro output is reduced. A 2024 International Energy Agency (IEA) analysis concluded that “an exceptional shortfall in hydropower due to extreme droughts – in China, the United States and several other economies – resulted in over 40% of the rise in emissions in 2023 as countries turned largely to fossil fuel alternatives to plug the gap.” And new analysis published just weeks ago by researchers at the Norwegian University of Science and Technology are similarly sounding the alarm for Europe’s power grids: “when droughts strike, hydropower and other renewables don’t work as well as they might. As a result, countries have to fire up more fossil fuel power plants…”
Reservoir hydro’s opportunity cost
Unlike many other generation sources, reservoir hydro has an opportunity cost. Since the water that accumulates behind the dam (and the MWh that can be generated) is finite, if some is used now, it can’t be used later. Because the amount of water inflow into the reservoir isn’t something in our control, generally, hydro plant operators must manage their output. If the operator used whatever water was available right away, the hydro plant would have less capacity later in the year to meet electric demand (because the reservoir level would be lower). Later, when there’s less hydro power available, the grid needs to turn to another fuel source — likely a fossil source — to serve its load. The emissions from burning that other fuel source to serve the grid load are the real marginal impact of consuming additional electricity on a grid with hydro resources.
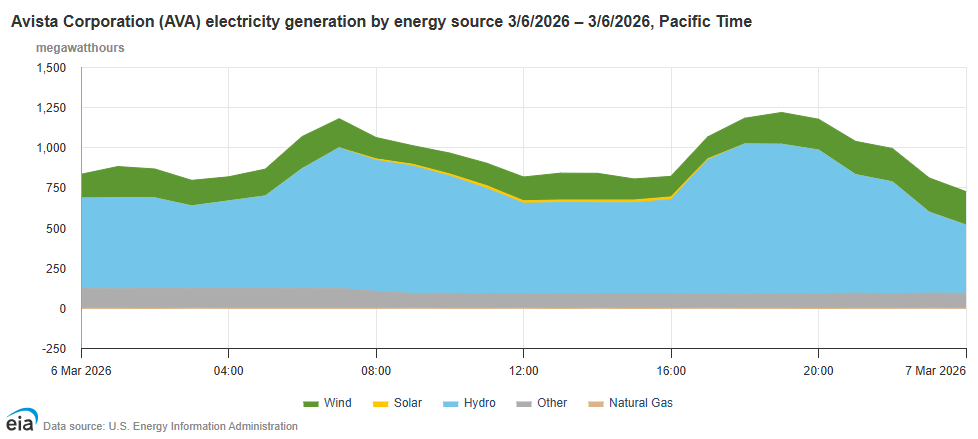
This might be surprising because it isn’t very obvious if you look at any one particular day. In hydro-dominated regions, you will see that hydro generation generally increases when grid demand increases, as generation roughly follows the load. Intuitively, this load-following behavior is characteristic of typical marginal generators (which respond to changes in load and, in some cases, set the marginal price in the electricity market). However, even if the hydro is the market’s marginal resource, that doesn’t mean it is marginal from an emissions perspective.
If grid load increases at 4:00 pm on a Friday, then hydro might be able to ramp up to satisfy that demand. But, that also means there’s less water available to generate electricity to meet the load at a later hour, say 5:00 pm the following Monday. Fossil fuels still end up serving the extra load from 4:00 pm that Friday, it’s just that they are burned at a later time (in this case at 5:00 pm Monday).
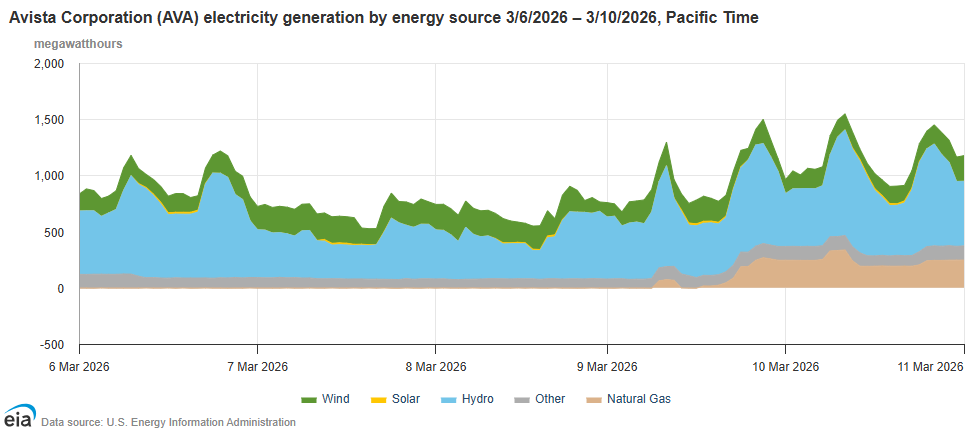
So even though the daily pattern can show hydro following load, when you look more broadly at a full week or more, a different story is revealed: increasing hydro generation in one hour simply means increased fossil usage at a later time.
Abrell & Kosch (2022) detected this empirically in Sweden and Germany, stating that “while at the hourly level RE replace a substantial amount of hydro generation, it is likely that in the case of reservoirs and pump-storage plants, this generation is shifted to another hour of the same week. This increase of hydro generation in other hours then replaces fossil generation and leads to an additional offset of carbon emissions. This effect cannot be observed at an hourly level, but is only accounted for when re-sampling the data to weekly values.”
This demonstrates how reservoir hydro is not actually marginal from an emissions standpoint. Even though its output can be dispatched up and down with load fluctuations, over longer periods the output cannot be increased for any reason other than that more rain fell and accumulated behind the dam.
Grid balancing via interchange
Due to hydro’s finite annual capacity, grids with hydro often coordinate with their neighbors to balance supply and demand. Let's look at Sweden and Germany. Sweden has a hydro-heavy grid and is generally a net exporter of electricity to neighboring countries, including Germany. However, when Germany often has a surplus of wind or solar generation, it sometimes exports that energy to Sweden. Research on cross-border electricity flows shows that when this happens, German renewable generation displaces Swedish hydro — effectively freeing up that stored water for use at other times or in other markets.
The same logic works in reverse: if demand goes up in Sweden, it exports less hydro to adjacent grids, and those adjacent grids may then have to turn to coal or natural gas to meet the demand previously supplied by Swedish hydro. So, even though Sweden’s grid is clean, a rise in domestic demand causes a fossil plant to ramp up somewhere, just not within Sweden.
Ultimately, this shows how dirtier resources in neighboring grids often set the marginal emissions rate for hydro regions, which is why we see higher-than-expected marginal emissions rates in those hydro-dominated regions.
Hydro as a water battery?
As we’ve seen, a grid operator can use hydro instead of burning fossil fuels, but later will need to burn more fuel to allow the reservoir to refill. Functionally, this ability to time-shift when fossil fuel power is needed means that reservoir hydro essentially acts like a battery (similar to its pumped-hydro storage cousin), allowing fossil-fuel generation to be shifted in time and even across grid boundaries.
A reservoir hydro “battery” can also time-shift renewable energy to displace fossil power. Bonneville Power Administration (BPA), which operates the US federal hydro system in the Pacific Northwest, is a clear example of this — effectively acting as a giant battery for California. During the day, when California's abundant solar generation exceeds its own demand and much of it is discarded (or at risk of curtailment), BPA imports some of that excess clean power and reduces hydro output. At night, when California's solar output drops but demand remains high, BPA exports power back south, displacing what would otherwise be fossil-fuel generation within the California grid. Every MWh of solar California exports that would have been curtailed is another MWh that can be returned at night to displace would-be fossil generation. As shown in Figure 5 below, this daily cycle is clearly visible in BPA's interchange with CAISO (California's grid operator) over a typical week.
Is hydro ever marginal?
The only way that hydro could be marginal from an operating emissions standpoint is if there is “spillage.” When a reservoir reaches its maximum water level, to prevent damage to the dam, operators must open spillway gates, which redirect water around the dam, bypassing the generating turbines, which would normally turn it into electricity. This spillage can occur if demand is low and the grid cannot accept additional hydro generation without undermining the grid’s system frequency.
In this situation, if demand increases, hydro generation can increase, allowing more water to flow through the turbines to generate electricity rather than bypassing them and being wasted. So the increase in demand is met by hydropower from otherwise-spilled water, meaning the additional demand causes zero emissions.
But, how often does spillage really happen? In the places we’ve found spillage data, the evidence shows us that it is exceedingly rare. For example, BPA data shows that there was only one hour over the past two years in which spillage actually occurred (0.005% of time). We have been unable to locate any data indicating this kind of spillage in other hydro heavy grids, such as Norway, Sweden, Quebec and Paraguay, but please share them with us if you come across these data!
So in theory, hydro can be marginal during spillage, but spillage seems to be so rare that in practice, it almost never is.
WattTime MOERs capture the holistic impact of hydro
Because reservoir hydro effectively functions as a "water battery," it shifts the timing of other dispatchable generation rather than eliminating the need for fossil fuels to balance the grid. In these systems, the true marginal impact of consuming an extra megawatt-hour is not the response of the zero-carbon hydro production at that moment, but rather the fossil-fuel combustion required later, either locally or through an interconnected neighbor.
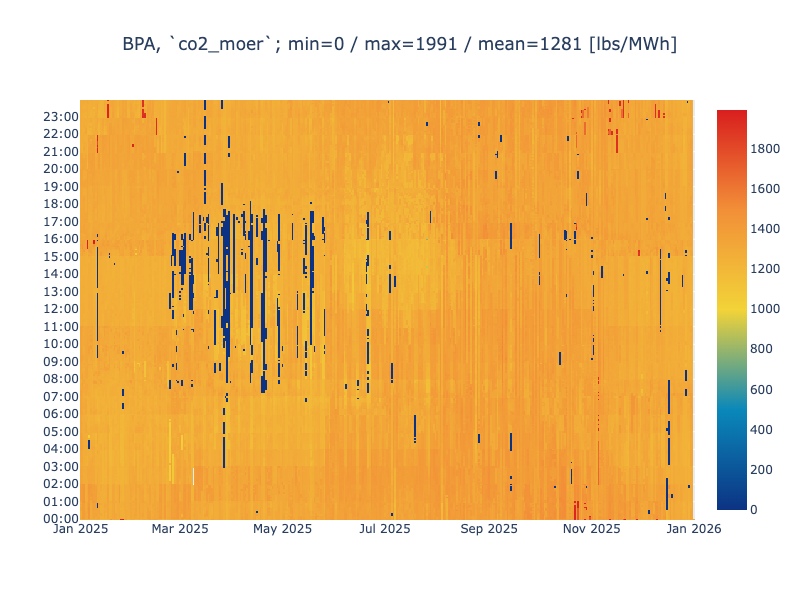
WattTime's Marginal Operating Emissions Rates (MOERs) capture these dynamics in real-time. WattTime empirically models the full system-wide impact — accounting for whether hydro is truly acting as a marginal resource in a given region, and reflecting imports and exports between regions to capture cases where the marginal generator sits entirely outside the local grid. As an example, BPA’s MOER heatmap for 2025 is shown in Figure 6, showing that for most hours of the year, from an emissions perspective, the marginal fuel is natural gas-fired generation (mostly from within California), with an emissions rate of roughly 1,200 lbs/MWh.
Remember, building a data center or carbon capture facility in the Pacific Northwest, Quebec, or Norway won’t cause more rain to fall there, so it would require generation from a non-hydro resource to meet its additional load. When it comes to planning and decision-making, assuming that a hydro-heavy grid means low emissions impact can lead you astray. You don't need to trace the temporal effects and causal chain through interchange yourself — you just need a marginal emissions rate that accurately reflects those dynamics at the system level. That's what WattTime MOERs are built to provide.
1. We recognize that hydropower reservoirs also emit methane, and the state of the science is still maturing on quantifying the consequential emissions relative to if the reservoir wasn’t built. It’s not yet clear whether the net consequential impact is an increase in emissions. Hydro’s methane emissions are not why a hydro grid has a high marginal emissions rate, because as you’ll see, the carbon intensity of hydro is almost never a factor in determining the marginal impact of load changes in a hydro region. (return to top)
2. Marginal emissions rate means the rate at which emissions are caused by a change in demand on the grid. When demand increases or decreases, a power plant will change its output to keep the grid in balance. The emissions factor of that responding power plant is the marginal emissions rate (return to top).