A Global Approach to Renewables Purchasing Could Reduce 370% More Emissions than Local Hourly Matching
This post explains one set of findings from a larger research paper.
The full overview and paper are here: Impact Accounting and Hourly Matching: A Review
Global impact accounting will also redirect corporate renewable investment from the US and Europe to the Global South.
The Greenhouse Gas Protocol is currently considering two proposals to revise the emissions accounting standard for electricity use and renewable energy purchasing. One proposal would add hourly matching & deliverability requirements, meaning that renewable energy could only be counted if matched to the hour and location where electricity is consumed. The other separate proposal describes how to report the consequential impact (the change to total global emissions) of projects, regardless of their time and location (this is also sometimes referred to as impact accounting or emissions matching).
While there have been many studies that investigate the impact of the hourly matching requirement [1,2,3], there has not been an investigation into the global scale impact of the deliverability requirement (procuring renewable energy on the same grid as your load). Most studies have focused on voluntary renewable energy purchasing in the USA or Europe, which have the highest levels of renewable energy purchasing and comparatively low emissions per MWh. However, there are many countries in the world with much dirtier grids but low levels of renewable energy purchasing. Increased procurement of renewables in these countries could provide a much higher impact on avoided emissions per dollar spent, while simultaneously reducing health problems from local pollution and investing in historically under-invested economies.
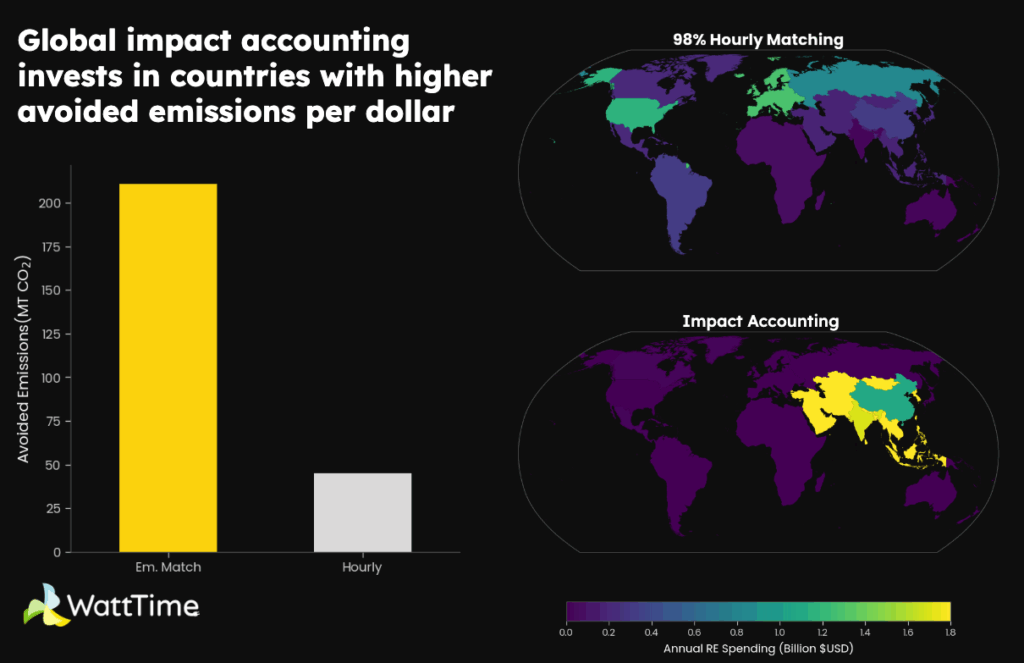
We studied the impacts on global voluntary renewable energy purchasing that could result from an hourly matching & deliverability standard and separately, from an impact accounting standard. We found that for a fixed cost, impact accounting avoids over 211 MT CO2 per year, 4.7 times more than hourly matching with deliverability.
Methodology and Data
To model this, we simulated procurement portfolios globally under both an hourly matching & deliverable standard (“hourly matching” from here on) and an impact accounting standard. While the GHGP Scope 2 protocol is used globally, it is a voluntary standard that not all companies choose to follow. To estimate the relative levels of participation, we used the amount of purchased renewable energy from the 2024 Corporate Renewable Electricity Sourcing Trends report published by CDP. This report only covers companies that reported their location-based scope 2 emissions to CDP, which serves as a reasonable representation of the distribution of voluntary corporate purchases under the GHGP today. The distribution of historical voluntary purchasing is heavily skewed to the Global North, with the highest levels of renewable energy purchasing in Europe excluding Russia (175 TWh) and the USA (124 TWh).
We modeled the purchasing decisions using a linear program (LP) method, which optimizes for the least-cost global voluntary energy purchasing of wind, solar, and battery resources subject to local hourly matching and emissions matching constraints. All procurement is assumed to be new build and fully additional. Global technology costs are taken from the IEA’s 2024 World Energy Outlook. We used the capital and operating costs for 2030 under the “Stated Policies” scenario. To annualize the capital costs, we amortized the costs over a 25-year lifetime and apply a 10% additional cost of capital.
For hourly matching, we added the matching and local procurement constraint for an amount of load equal to the purchased renewable energy in each country (as reported by CDP). For impact accounting, we measure the induced emissions from load and the avoided emissions from renewable projects using the Combined Marginal Emissions Rate (CMER), which is the combined average of the Marginal Build Emissions Rate (MBER) and the Marginal Operating Emissions Rate (MOER). There is no location constraint for impact accounting, so projects can be selected from anywhere on the globe. To ensure that the solutions are reasonable, we add a constraint that the procured projects cannot exceed more than 20% of the total existing capacity from all generators in the country. This guarantees a solution where projects are spread among many countries, instead of concentrated in a single country with a volume that is impractical or unrealistic. If this constraint were removed, the model would concentrate procurement in a few countries with the highest emissions avoidance per cost, further amplifying the advantage of global impact accounting over hourly matching.
Global Impact Accounting Reduces More Emissions Per Dollar
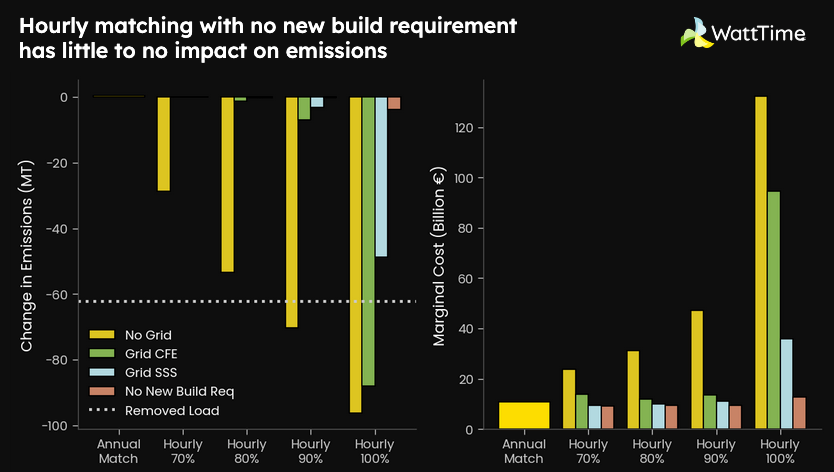
In 2024, corporations procured a total of 562 TWh of clean energy globally. While we don't know the total cost of those clean energy purchases, if those 562 TWh of clean energy were instead procured in locations that maximized their avoided emissions, that portfolio of renewable energy procurement would cost $4.6B and avoid 211 MT of carbon emissions per year. Alternatively, that same $4.6B spent towards a 98% hourly match with local deliverability requirements, would only avoid 45 MT CO2 per year (4.7 times fewer avoided emissions). We chose to compare both strategies at a fixed amount of spending, instead of a fixed level of participation, because hourly matching portfolios are significantly more expensive than impact accounting portfolios. The total cost for a 98% hourly matched portfolio is 16.5 times more expensive than impact accounting.
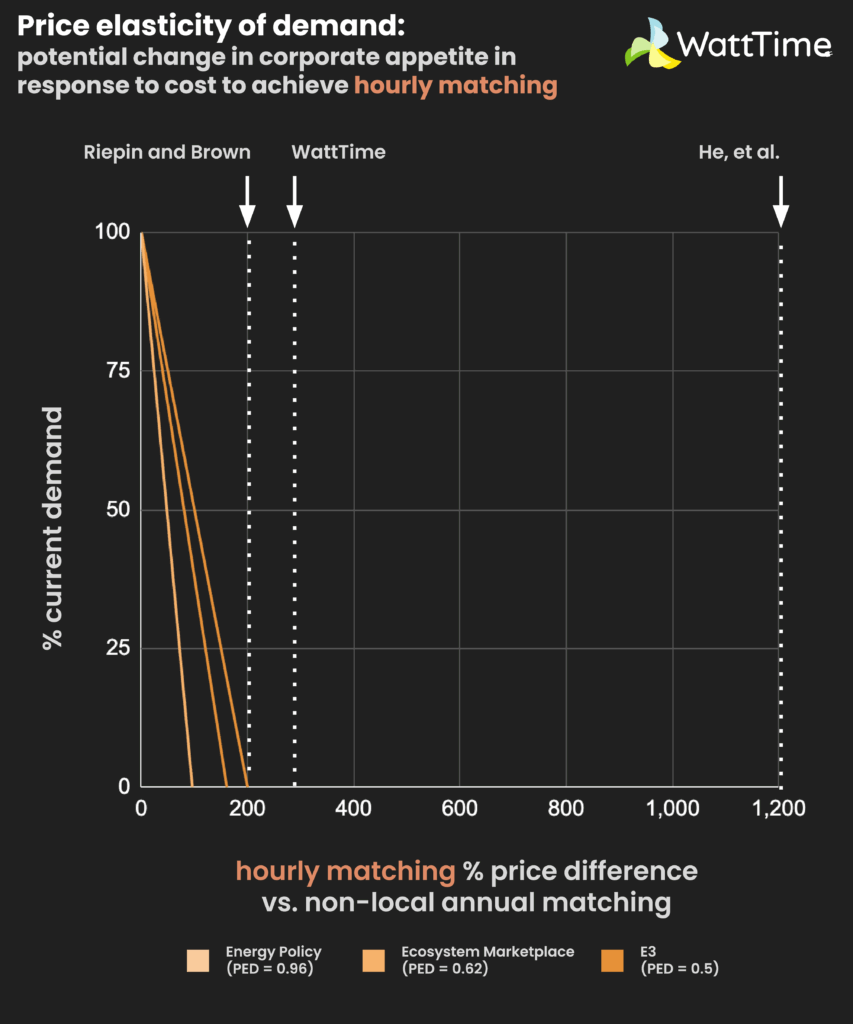
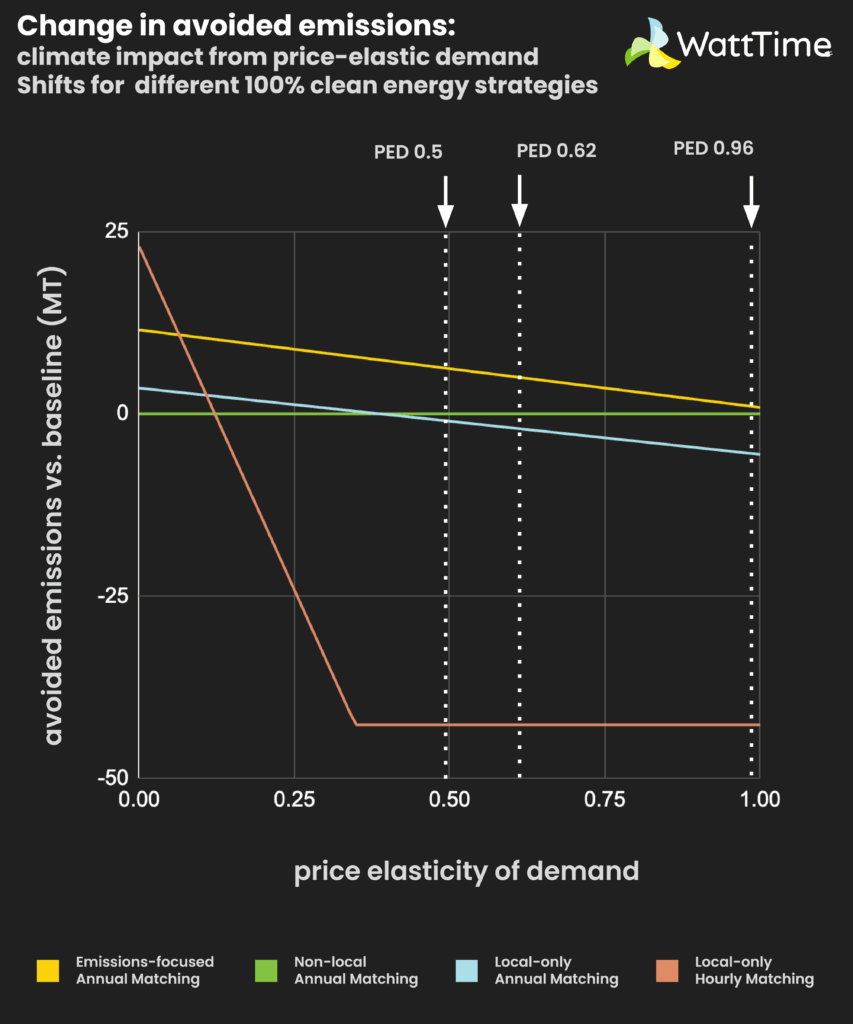
While some companies may be willing to pay a premium for reducing their scope 2 accounting, the expected trend is that fewer companies will voluntarily offset their scope 2 emissions as the cost of doing so increases because of basic demand elasticity (we explored this in a previous post analyzing participation vs. costs). Instead of assuming that participation will stay the same regardless of costs, as previous studies have done, we instead assumed there is a fixed budget available for voluntary corporate procurement. For the cost of all participants achieving 100% emissions matching, only 6% of participants could achieve an hourly matching score of 98%. While the exact amount and willingness to pay are not known, the difference in avoided emissions per dollar remains.
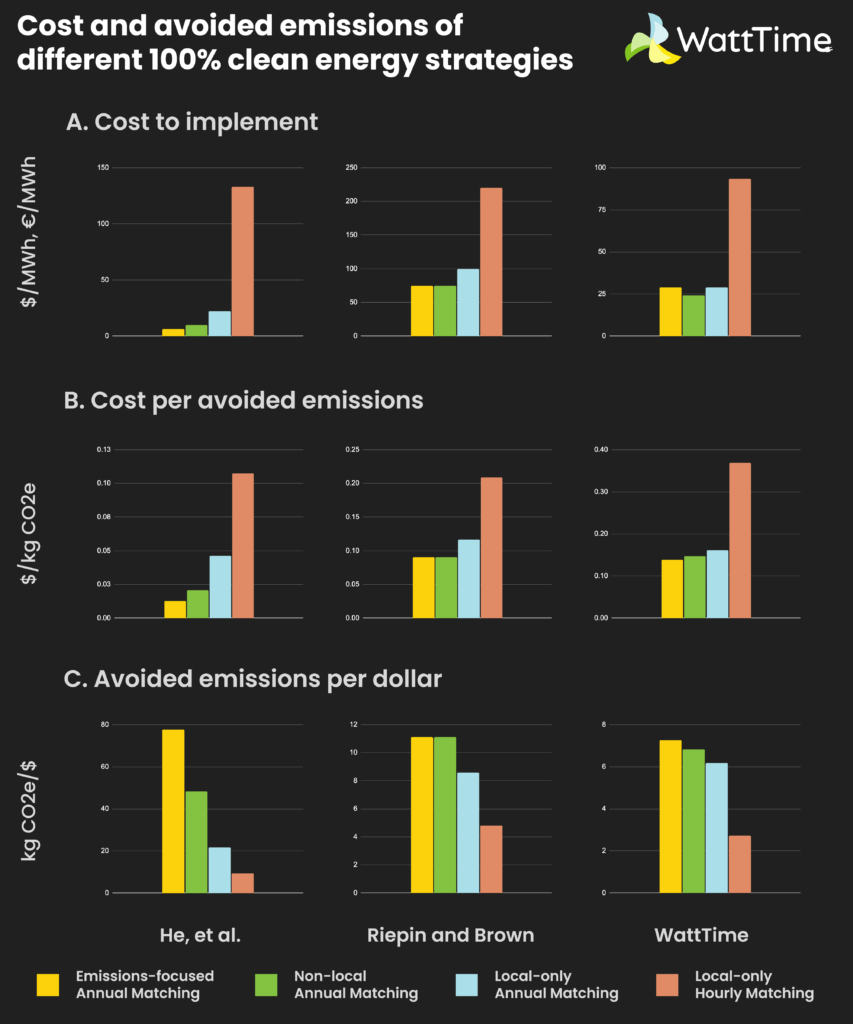
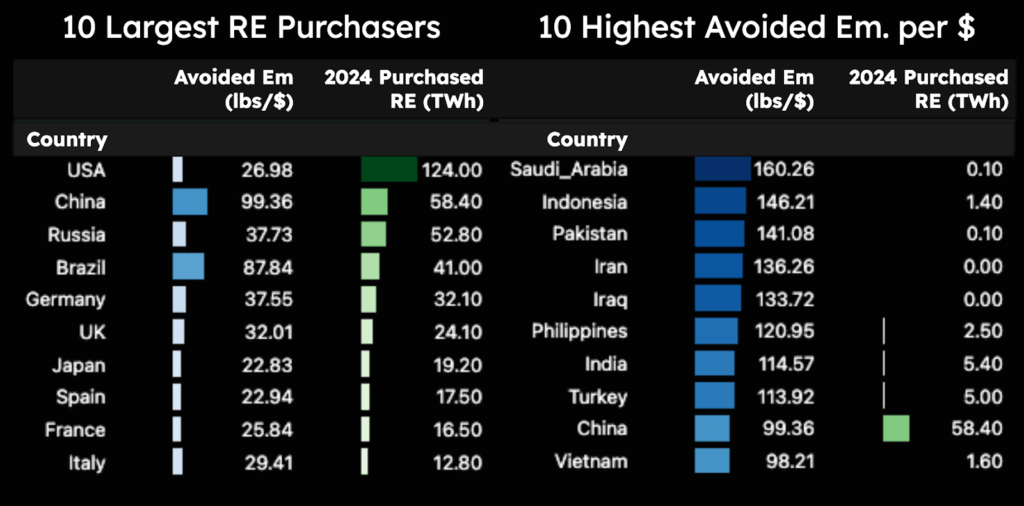
This difference in impact can be understood by looking at the average amount of avoided emissions per dollar spent for each strategy: 100 lbs CO2 per $USD for impact accounting vs. 21 lbs CO2 per $USD for hourly matching. These differences in avoided emissions per dollar spent reflect the fact that grids with historically high voluntary RE development are not grids with the highest marginal emissions rates. Below is a list of the top 10 countries for RE purchasing and the top 10 countries by avoided emissions rate per dollar. The countries with the highest levels of RE purchasing are largely in the US or Europe, but also include China and Brazil. China is the only country with high levels of voluntary RE purchasing to also appear in the list of high-impact countries, which are primarily countries with developing economies in the Global South that have very low levels of voluntary RE purchasing today and high levels of fossil fuel generation.
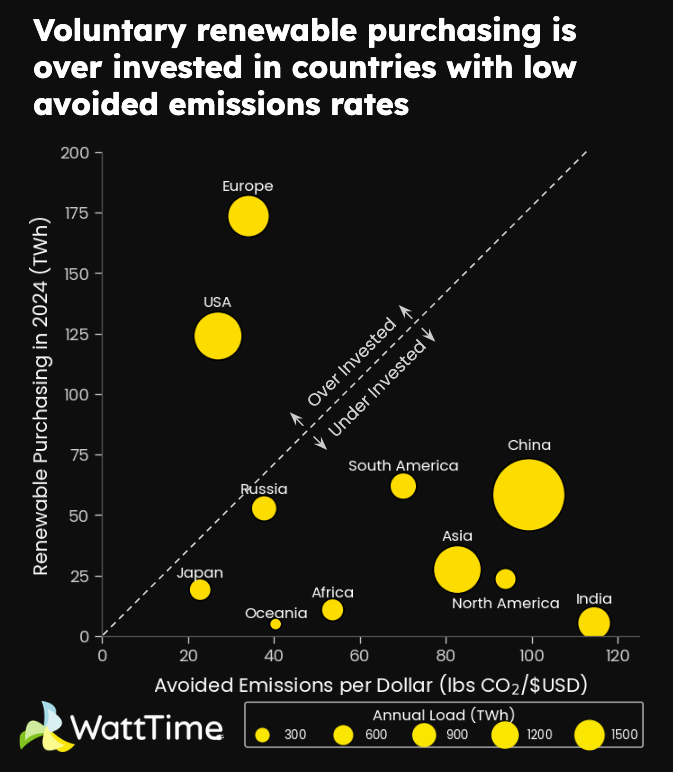
Below, we also plot the average avoided emissions per dollar for the 5 largest countries by load, along with the average aggregated by region, excluding those 5 countries. Comparing the average avoided emissions per dollar and the level of existing purchases of renewables shows where today’s investing is highly concentrated in locations with low avoided emissions per dollar and locations with more cost-effective impact are underinvested. India and China have an avoided emissions impact of 114 and 99 lbs CO2/$USD respectively, compared with a rate of 34 and 27 lbs CO2/$USD for Europe and USA respectively. The average rates for the Americas and Asia, at 96 and 83 lbs CO2/$USD, are higher than the average rate in Africa of 54 lbs CO2/$USD. The aggregated rates are averages, and the countries inside a region can still have a large spread of avoided emissions rates.
Impact Accounting Directs Investments from the Global North to the Global South
We analyzed the locations where annual RE spending could go under an hourly matching and an impact accounting standard with the same amount of total investment. Under hourly matching, the local matching requirement means investment would be concentrated in the US and Europe, similar to how it is today. Under impact accounting, the optimal distribution of investment today is almost entirely in Asia. This means a dollar invested in Asia will avoid the most CO2. However, investors may prefer other locations when non-climate factors are considered, and they can still choose more impactful locations outside of Asia that aren’t in their local grids.
A consequential impact accounting standard without a local matching requirement could incentivize companies based in the Global North to purchase renewable energy projects in countries in the Global South for much more cost-effective decarbonization than local hourly matching. This could potentially provide an economic benefit to these countries by creating demand for RE projects, as well as pressuring grids to allow renewable energy purchasing agreements, such as VPPAs, which would make even more RE development possible. In addition to the economic and carbon benefits, many of these countries have very poor air quality from fossil fuel generation, leading to significant health problems and loss of life. A recent study found that air pollution in India increased deaths by 1.5 million per year. Increased development of renewable energy would displace fossil fuel generation in many of these countries, reducing global carbon emissions and improving local health at the same time.
Why Scope 2 Should Embrace a Global Approach to Procurement
Research suggests that local hourly matching in the US and Europe could help reduce meaningful amounts of emissions only at high levels of matching and only if it includes an additionality requirement, which the current Scope 2 proposal does not. However, achieving a high level of additional hourly matching has also been shown to be up to four-times more expensive and might reduce voluntary participation. The local deliverability requirement also has the impact of continuing to concentrate renewable energy investment in the US and Europe, where significant progress on decarbonization has already been made, so adding it would even further erode the emissions reduction effectiveness of the accounting standard.
A change to the Scope 2 protocol in favor of local hourly matching would undermine the overall effectiveness of voluntary corporate renewable energy purchasing. Local hourly matching is much less efficient than global impact accounting, which avoids more emissions per dollar. Global impact accounting could increase the impact of voluntary renewable energy purchasing in two ways: first, each dollar spent achieves greater emissions reductions, and second, more actors are likely to participate due to the lower costs. In addition, hourly matching would continue to concentrate renewable energy development in regions such as the U.S. and Europe, which already have a strong appetite for grid decarbonization, while limiting investments in countries where benefits are greater.Instead, allowing for impact accounting regardless of location could direct investment to countries that are at the beginning stages of decarbonization. Prioritizing these countries could reduce more emissions while addressing global inequity at the same time. Corporations such as Salesforce, Heineken and Amazon have already begun to purchase renewable energy across Africa, Southeast Asia and Latin America in order to prioritize high impact projects. A change to the Scope 2 protocol in favor of local hourly matching threatens the future of projects like these, since many would not be credited under such a standard. A global consequential impact accounting standard would instead incentivize companies to explore outside of their local boundaries and pursue more impactful projects worldwide.